SQL Server UNIFORM Function
Updated 2024-03-13 14:28:54.580000
Description
Use the scalar function UNIFORM to calculate the probability density function or the lower cumulative distribution function of the uniform distribution.
The formula for the probability density function is:
f(x) = \begin{cases} \frac{1}{b-a} & \text{for } a \le x \le b, \\[8pt] 0 & \text{for } x < a \ \text{ or } \ x > b. \end{cases}
The lower cumulative distribution function is:
F(x) = \begin{cases} 0 & \text{for } x < a, \\[8pt] \frac{x-a}{b-a} & \text{for } a \le x \le b, \\[8pt] 1 & \text{for } x > b. \end{cases}
Syntax
SELECT [westclintech].[wct].[UNIFORM] (
  <@X, float,>
 ,<@Min, float,>
 ,<@Max, float,>
 ,<@Cumulative, bit,>)
Arguments
@X
is the value to be evaluated. @X is an expression of type float or of a type that implicitly converts to float.
@Min
is the minimum value of the distribution. @Min is an expression of type float or of a type that implicitly converts to float.
@Max
is the maximum value of the distribution. @Max is an expression of type float or of a type that implicitly converts to float.
@Cumulative
is a logical value that determines if the probability density function ('False', 0) or the cumulative distribution function ('True', 1) is being calculated. @Cumulative is an expression of type bit or of a type that implicitly converts to bit.
Return Type
float
Remarks
@Max must be greater than or equal to @Min (@Max > @Min).
Examples
Calculate the probability density function:
SELECT wct.UNIFORM(2, 1, 5, 'False');
This produces the following result.
{"columns":[{"field":"column 1","headerClass":"ag-right-aligned-header","cellClass":"ag-right-aligned-cell"}],"rows":[{"column 1":"0.25"}]}
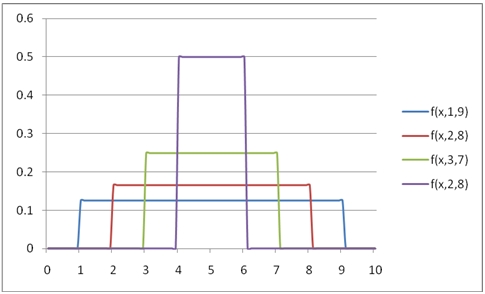
You can use the SeriesFloat function from the XLeratorDB/math library to generate a dataset which can be pasted into EXCEL to generate a graph of the probability density function.
SELECT SeriesValue,
       wct.UNIFORM(SeriesValue, 1, 9, 'False') as [f(x,1,9)],
       wct.UNIFORM(SeriesValue, 2, 8, 'False') as [f(x,2,8)],
       wct.UNIFORM(SeriesValue, 3, 7, 'False') as [f(x,3,7)],
       wct.UNIFORM(SeriesValue, 4, 6, 'False') as [f(x,2,8)]
FROM wct.SeriesFloat(0, 10, .1, NULL, NULL);
This is an EXCEL-generated graph of the results
Calculate the lower cumulative distribution function:
SELECT wct.UNIFORM(3, 1, 5, 'True');
This produces the following result.
{"columns":[{"field":"column 1","headerClass":"ag-right-aligned-header","cellClass":"ag-right-aligned-cell"}],"rows":[{"column 1":"0.5"}]}
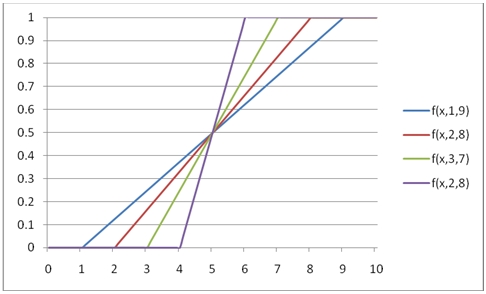
You can use the SeriesFloat function from the XLeratorDB/math library to generate a dataset which can be pasted into EXCEL to generate a graph of the cumulative distribution function.
SELECT SeriesValue,
       wct.UNIFORM(SeriesValue, 1, 9, 'True') as [f(x,1,9)],
       wct.UNIFORM(SeriesValue, 2, 8, 'True') as [f(x,2,8)],
       wct.UNIFORM(SeriesValue, 3, 7, 'True') as [f(x,3,7)],
       wct.UNIFORM(SeriesValue, 4, 6, 'True') as [f(x,2,8)]
FROM wct.SeriesFloat(0, 10, .1, NULL, NULL);
This is an EXCEL-generated graph of the results.