SQL Server TPDF Function
Updated 2024-03-13 14:11:00.017000
Description
Use TPDF to calculate the probability density function of the T distribution.
The formula for the probability density function is:
f(t) = \frac{ 1 }{\ \sqrt{\nu\ }\ {\mathrm B}\left( \frac{\ 1\ }{ 2 },\ \frac{\ \nu\ }{ 2 }\right)\ } \ \left(\ 1 + \frac{\ t^2\ }{ \nu }\ \right)^{-(\nu+1)/2}\
Where
{
    "columns": [
        {
            "field": "column 1",
            "maxWidth": 100
        },
        {
            "field": "column 2",
            "maxWidth": 325
        }
    ],
    "rows": [
        {
            "column 1": "t",
            "column 2": "the t-statistic"
        },
        {
            "column 1": "v",
            "column 2": "the degrees of freedom"
        },
        {
            "column 1": "B",
            "column 2": "the Beta function"
        }
    ]
}
Syntax
SELECT [westclintech].[wct].[TPDF] (
  <@X, float,>
 ,<@Degrees_freedom, float,>)
Arguments
@X
the variable to be evaluated. @X is an expression of type float or of a type that implicitly converts to float.
Return Type
float
Remarks
@Degrees_Freedom must be greater than zero (@DF > 0).
Examples
Calculate the probability density function:
SELECT wct.TPDF(1, 3) as [T pdf];
This produces the following result.
{"columns":[{"field":"T pdf","headerClass":"ag-right-aligned-header","cellClass":"ag-right-aligned-cell"}],"rows":[{"T pdf":"0.206748335783172"}]}
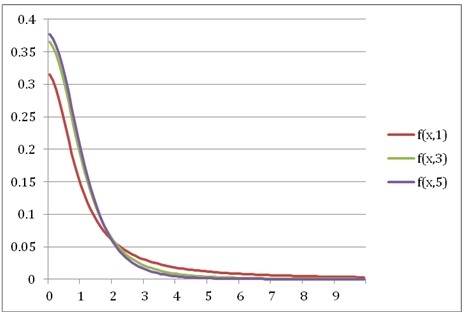
You can use the SeriesFloat function from the XLeratorDB/math module to generate a dataset which can be pasted into EXCEL to generate a graph of the probability density function.
SELECT SeriesValue,
       wct.NCTPDF(SeriesValue, 1, 1) as [f(x,1,1)],
       wct.NCTPDF(SeriesValue, 3, 1) as [f(x,3,1)],
       wct.NCTPDF(SeriesValue, 5, 1) as [f(x,5,1)],
       wct.NCTPDF(SeriesValue, 1, 3) as [f(x,1,3)],
       wct.NCTPDF(SeriesValue, 1, 5) as [f(x,1,5)]
FROM wct.SeriesFloat(.1, 10, .1, NULL, NULL);
This is an EXCEL-generated graph of the results