SQL Server NEGBINOMDISTP Function
Updated 2024-03-12 20:54:58.633000
Description
Use the scalar function NEGBINOMDISTP to calculate the cumulative distribution function of the negative binomial distribution.
The formula for the cumulative distribution function is:
F(k; r, p) \equiv \Pr(X\le k) = I_{p}(r, k+1)
where Ip(a, b) is the regularized incomplete beta function.
Syntax
SELECT [westclintech].[wct].[NEGBINOMDISTP] (
  <@Number_f, float,>
 ,<@Number_s, float,>
 ,<@Probability_s, float,>)
Arguments
@Number_f
is the number of failures. @Number_f is an expression of type float or of a type that implicitly converts to float.
@Number_s
is the number of successes. @Number_s is an expression of type float or of a type that implicitly converts to float.
@Probability_s
is the probability of success. @Probability_s is an expression of type float or of a type that implicitly converts to float.
Return Type
float
Remarks
@Probability_s must be greater than or equal to zero and less than or equal to one (0 = @Probability_s = 1).
@Number_f must be greater than or equal to zero (0 = @Number_f).
@Number_s must be greater than or equal to one (1= @Number_s).
@Number_f is truncated to an integer.
@Number_s is truncated to an integer.
Examples
SELECT wct.NEGBINOMDISTP(4, 90, 0.975);
This produces the following result.
{"columns":[{"field":"column 1","headerClass":"ag-right-aligned-header","cellClass":"ag-right-aligned-cell"}],"rows":[{"column 1":"0.912840044254324"}]}
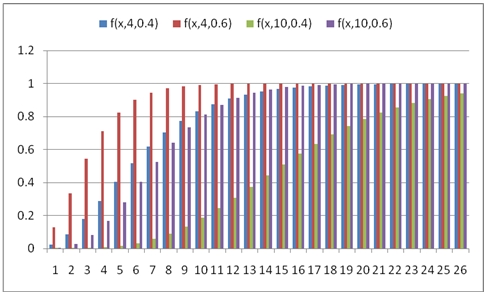
You can use the SeriesInt function from the XLeratorDB/math library to generate a dataset which can be pasted into EXCEL to generate a graph of the cumulative distribution function.
SELECT SeriesValue,
       wct.NEGBINOMDISTP(SeriesValue, 4, 0.4) as [f(x,4,0.4)],
       wct.NEGBINOMDISTP(SeriesValue, 4, 0.6) as [f(x,4,0.6)],
       wct.NEGBINOMDISTP(SeriesValue, 10, 0.4) as [f(x,10,0.4)],
       wct.NEGBINOMDISTP(SeriesValue, 10, 0.6) as [f(x,10,0.6)]
FROM wct.SeriesInt(0, 25, NULL, NULL, NULL);
This is an EXCEL-generated graph of the results.