SQL Server NCTPDF Function
Updated 2024-03-12 20:45:54.030000
Description
Use the scalar function NCTPDF to calculate the probability density function of the non-central T distribution.
The formula for the probability density function is:
f(x)= \begin{cases} \frac{\nu}{x} \left \{ F_{\nu+2,\mu} \left (x\sqrt{1+\frac{2}{\nu}} \right ) - F_{\nu,\mu}(x)\right \}, &\mbox{if } x\neq 0; \\\\ \frac{\Gamma(\frac{\nu+1}{2})}{\sqrt{\pi\nu} \Gamma(\frac{\nu}{2})} \exp\left (-\frac{\mu^2}{2}\right), &\mbox{if } x=0. \end{cases}
Where Fν,μ(x) is the noncentral T cumulative distribution function.
Syntax
SELECT [westclintech].[wct].[NCTPDF] (
  <@X, float,>
 ,<@DF, float,>
 ,<@Lambda, float,>)
Arguments
@X
is the variable to be evaluated. @X is an expression of type float or of a type that implicitly converts to float.
@DF
degrees of freedom. @DF is an expression of type float or of a type that implicitly converts to float.
@Lambda
is the non-centrality parameter. @Lambda is an expression of type float or of a type that implicitly converts to float.
Return Type
float
Remarks
@X must be greater than zero (@X > 0).
@DF must be greater than zero (@DF > 0).
@Lambda must be greater than or equal to zero (@Lambda > 0).
Examples
Calculate the probability density function:
SELECT wct.NCTPDF(1, 3, 3);
This produces the following result.
{"columns":[{"field":"column 1","headerClass":"ag-right-aligned-header","cellClass":"ag-right-aligned-cell"}],"rows":[{"column 1":"0.0700404713849545"}]}
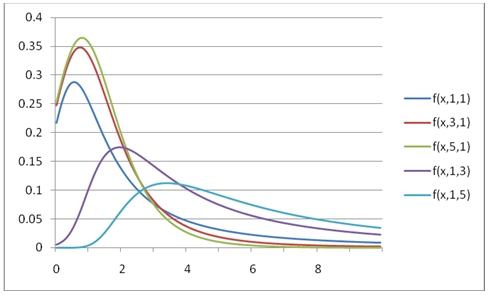
You can use the SeriesFloat function from the XLeratorDB/math library to generate a dataset which can be pasted into EXCEL to generate a graph of the probability density function.
SELECT SeriesValue,
       wct.NCTPDF(SeriesValue, 1, 1) as [f(x,1,1)],
       wct.NCTPDF(SeriesValue, 3, 1) as [f(x,3,1)],
       wct.NCTPDF(SeriesValue, 5, 1) as [f(x,5,1)],
       wct.NCTPDF(SeriesValue, 1, 3) as [f(x,1,3)],
       wct.NCTPDF(SeriesValue, 1, 5) as [f(x,1,5)]
FROM wct.SeriesFloat(.1, 10, .1, NULL, NULL);
This is an EXCEL-generated graph of the results.