SQL Server NCHISQPDF Function
Updated 2024-03-11 21:24:42.457000
Description
Use the scalar function NCHISQPDF to calculate the probability density function of the non-central chi square distribution.
The probability density function is:
f_X(x; k,\lambda) = \sum_{i=0}^\infty \frac{e^{-\lambda/2} (\lambda/2)^i}{i!} f_{Y_{k+2i}}(x)
Where Yq is distributed as chi-squared with q degrees of freedom.
Syntax
SELECT [westclintech].[wct].[NCHISQPDF] (
  <@X, float,>
 ,<@DF, float,>
 ,<@Lambda, float,>)
Arguments
@X
is any real number. @X is an expression of type float or of a type that implicitly converts to float.
@DF
is the degrees of freedom. @DF is an expression of type float or of a type that implicitly converts to float.
@Lambda
is the non-centrality parameter. @Lambda is an expression of type float or of a type that implicitly converts to float.
Return Type
float
Remarks
@DF must be greater than zero (@DF > 0).
@Lambda must be greater than or equal to zero (@Lambda = 0).
@X must be greater than or equal to zero (@X = zero).
Examples
SELECT wct.NCHISQPDF(1, 3, 1);
This produces the following result.
{"columns":[{"field":"column 1","headerClass":"ag-right-aligned-header","cellClass":"ag-right-aligned-cell"}],"rows":[{"column 1":"0.172475656944122"}]}
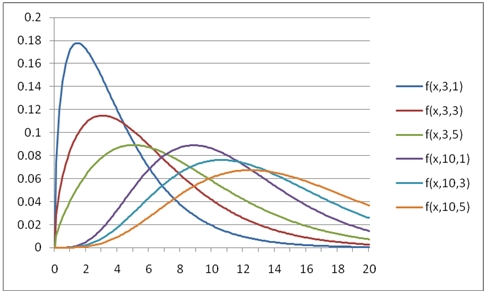
You can use the SeriesFloat function from the XLeratorDB/math library to generate a dataset which can be pasted into EXCEL to generate a graph of the function.
SELECT SeriesValue,
       wct.NCHISQPDF(SeriesValue, 3, 1) as [f(x,3,1)],
       wct.NCHISQPDF(SeriesValue, 3, 3) as [f(x,3,3)],
       wct.NCHISQPDF(SeriesValue, 3, 5) as [f(x,3,5)],
       wct.NCHISQPDF(SeriesValue, 10, 1) as [f(x,10,1)],
       wct.NCHISQPDF(SeriesValue, 10, 3) as [f(x,10,3)],
       wct.NCHISQPDF(SeriesValue, 10, 5) as [f(x,10,5)]
FROM wct.SeriesFloat(0.0, 20, .1, NULL, NULL);
This is an EXCEL-generated graph of the results.