SQL Server NCFCDF Function
Updated 2024-03-11 13:25:06.087000
Description
Use the scalar function NCFCDF to calculate the lower cumulative distribution function of the non-central F distribution.
The formula for the lower cumulative distribution function is:
F(x\mid d_1,d_2,\lambda)=\sum\limits_{j=0}^\infty\left(\frac{\left(\frac{1}{2}\lambda\right)^j}{j!}e^{-\lambda/2} \right)I\left(\frac{d_1x}{d_2 + d_1x}\bigg|\frac{d_1}{2}+j,\frac{d_2}{2}\right)
Where I is the regularized incomplete beta function.
Syntax
SELECT [westclintech].[wct].[NCFCDF] (
  <@X, float,>
 ,<@DF1, float,>
 ,<@DF2, float,>
 ,<@Lambda, float,>)
Arguments
@X
is the variable to be evaluated. @X is an expression of type float or of a type that implicitly converts to float.
@DF1
degrees of freedom. @DF1 is an expression of type float or of a type that implicitly converts to float.
@DF2
degrees of freedom. @DF2 is an expression of type float or of a type that implicitly converts to float.
@Lambda
is the non-centrality parameter. @Lambda is an expression of type float or of a type that implicitly converts to float.
Return Type
float
Remarks
@X must be greater than zero (@X > 0).
@DF1 must be greater than zero (@DF1 > 0).
@DF2 must be greater than zero (@DF2 > 0).
@Lambda must be greater than or equal to zero (@Lambda > 0).
Examples
Calculate the lower cumulative distribution function:
SELECT wct.NCFCDF(0.5, 3, 2, 1);
This produces the following result.
{"columns":[{"field":"column 1","headerClass":"ag-right-aligned-header","cellClass":"ag-right-aligned-cell"}],"rows":[{"column 1":"0.210838872156613"}]}
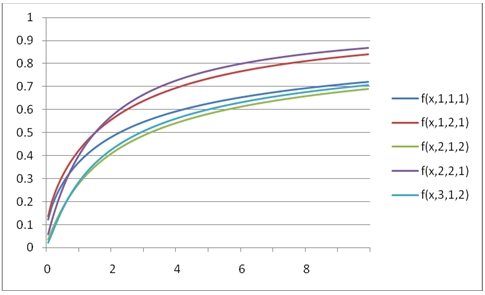
You can use the SeriesFloat function from the XLeratorDB/math library to generate a dataset which can be pasted into EXCEL to generate a graph of the cumulative distribution function.
SELECT SeriesValue,
       wct.NCFCDF(SeriesValue, 1, 1, 1) as [f(x,1,1,1)],
       wct.NCFCDF(SeriesValue, 1, 2, 1) as [f(x,1,2,1)],
       wct.NCFCDF(SeriesValue, 2, 1, 2) as [f(x,2,1,2)],
       wct.NCFCDF(SeriesValue, 2, 2, 1) as [f(x,2,2,1)],
       wct.NCFCDF(SeriesValue, 3, 1, 2) as [f(x,3,1,2)]
FROM wct.SeriesFloat(.1, 10, .1, NULL, NULL);
This is an EXCEL-generated graph of the results.