SQL Server LOGNORMPDF Function
Updated 2024-03-08 21:35:15.753000
Description
Use the scalar function LOGNORMPDF to calculate the probability density function of the lognormal distribution.
The formula for the probability density function is:
f(x;\mu,\sigma)=\frac{1}{x\sqrt{2\pi\sigma^2}}e^{\left(-\frac{(\ln{x-\mu})^2}{2\sigma^2} \right)}
Syntax
SELECT [westclintech].[wct].[LOGNORMPDF] (
  <@X, float,>
 ,<@Mean, float,>
 ,<@Standard_dev, float,>)
Arguments
@X
is the variable to be evaluated. @X is an expression of type float or of a type that implicitly converts to float.
@Mean
is the mean of the variable's natural logarithm. @Mean is an expression of type float or of a type that implicitly converts to float.
@Standard_dev
is the standard deviation of the variable's natural logarithm. @B is an expression of type float or of a type that implicitly converts to float.
Return Type
float
Remarks
@X must be greater than zero (@X > 0).
@Standard_dev must be greater than zero (@Standard_dev > 0).
Use LOGNORMDIST to calculate the upper cumulative distribution.
Examples
Calculate the probability density function:
SELECT wct.LOGNORMPDF(1, 0, 1);
This produces the following result.
{"columns":[{"field":"column 1","headerClass":"ag-right-aligned-header","cellClass":"ag-right-aligned-cell"}],"rows":[{"column 1":"0.398942280401433"}]}
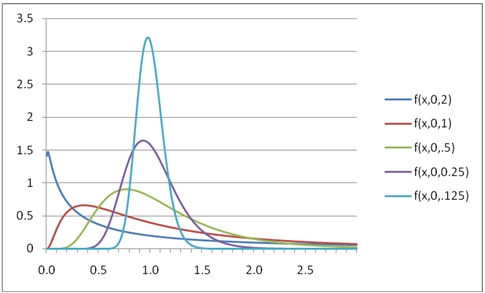
You can use the SeriesFloat function from the XLeratorDB/math library to generate a dataset which can be pasted into EXCEL to generate a graph of the probability density function.
SELECT SeriesValue,
       wct.LOGNORMPDF(SeriesValue, 0, 2) as [f(x,0,2)],
       wct.LOGNORMPDF(SeriesValue, 0, 1) as [f(x,0,1)],
       wct.LOGNORMPDF(SeriesValue, 0, .5) as [f(x,0,.5)],
       wct.LOGNORMPDF(SeriesValue, 0, 0.25) as [f(x,0,0.25)],
       wct.LOGNORMPDF(SeriesValue, 0, 0.125) as [f(x,0,.125)]
FROM wct.SeriesFloat(0.01, 3, .01, NULL, NULL);
This is an EXCEL-generated graph of the results.