SQL Server FPDF Function
Updated 2024-03-07 22:05:33.173000
Description
Use the scalar function FPDF to calculate the probability density function of the F distribution.
The probability density function with degrees of freedom d1 and d2 is:
f(x; d_1,d_2)=\frac{1}{\operatorname{B}\left(\frac{d_1}{2},\frac{d_2}{2}\right)} \left(\frac{d_1}{d_2}\right)^{\frac{d_1}{2}} x^{\frac{d_1}{2} - 1} \left(1+\frac{d_1}{d_2} \, x \right)^{-\frac{d_1+d_2}{2}}
where B is the beta function.
Syntax
SELECT [westclintech].[wct].[FPDF] (
  <@X, float,>
 ,<@Degrees_freedom1, float,>
 ,<@Degrees_freedom2, float,>)
Arguments
@X
is any real number. @X is an expression of type float or of a type that implicitly converts to float.
@Degrees_freedom1
is the degrees of freedom. @Degrees_freedom1 is an expression of type float or of a type that implicitly converts to float.
@Degrees_freedom2
is the degrees of freedom. @Degrees_freedom2 is an expression of type float or of a type that implicitly converts to float.
Return Type
float
Remarks
@Degrees_freedom1 must be greater than zero (@Degrees_freedom1 > 0).
@Degrees_freedom2 must be greater than zero (@Degrees_freedom2 > 0).
@X must be greater than or equal to zero (@X = zero).
If @X = 0 and @Degrees_freedom1 = 1 and @Degrees_freedom2 =1 then FPDF is equal to infinity.
Examples
SELECT wct.FPDF(1, 2, 1);
This produces the following result.
{"columns":[{"field":"column 1","headerClass":"ag-right-aligned-header","cellClass":"ag-right-aligned-cell"}],"rows":[{"column 1":"0.192450089729876"}]}
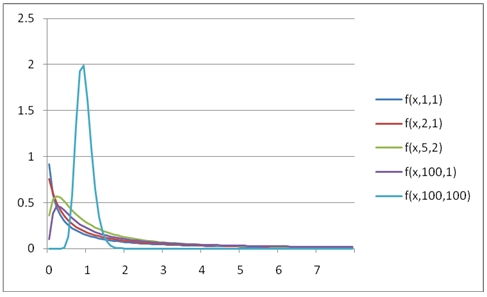
You can use the SeriesFloat function from the XLeratorDB/math library to generate a dataset which can be pasted into EXCEL to generate a graph of the function.
SELECT SeriesValue,
       wct.FPDF(SeriesValue, 1, 1) as [f(x,1,1)],
       wct.FPDF(SeriesValue, 2, 1) as [f(x,2,1)],
       wct.FPDF(SeriesValue, 5, 2) as [f(x,5,2)],
       wct.FPDF(SeriesValue, 100, 1) as [f(x,100,1)],
       wct.FPDF(SeriesValue, 100, 100) as [f(x,100,100)]
FROM wct.SeriesFloat(0.1, 8, .1, NULL, NULL);
This is an EXCEL-generated graph of the results.