SQL Server BETAPDF Function
Updated 2023-11-02 16:01:50.550000
Description
Use the scalar function BETAPDF to calculate the probability density function for the beta distribution.
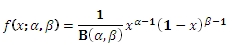
The probability density function of the beta distribution is:
Syntax
SELECT [westclintech].[wct].[BETAPDF] (
  <@X, float,>
 ,<@P, float,>
 ,<@Q, float,>
 ,<@A, float,>
 ,<@B, float,>)
Arguments
@X
is any real number. @X is an expression of type float or of a type that implicitly converts to float. @X is the value between @P and @Q at which to evaluate the function.
@P
is any real number. @P is an expression of type float or of a type that implicitly converts to float. @A is a parameter to the distribution.
@Q
is any real number. @Q is an expression of type float or of a type that implicitly converts to float. @Q is a parameter to the distribution.
@A
is any real number. @A is an expression of type float or of a type that implicitly converts to float. @A is the lower bound to the distribution. If you enter NULL, @A defaults to zero (0).
@B
is any real number. @B is an expression of type float or of a type that implicitly converts to float. @B is the upper bound to the distribution. If you enter NULL, @B defaults to one (1).
Return Type
float
Remarks
If @X = 0, BETAPDF will return an error.
If @P = 0 or @Q = 0, BETAPDF will return an error.
If @X< @A or @X > @B or @A = @B, BETAPDF will return an error.
If you enter NULL for @A and @B, BETAPDF will use zero and one.
For the cumulative density function, use BETADIST.
Examples
SELECT wct.BETAPDF(7, 5, 10, 6, 8);
This produces the following result.
{"columns":[{"field":"column 1","headerClass":"ag-right-aligned-header","cellClass":"ag-right-aligned-cell"}],"rows":[{"column 1":"0.610961914062504"}]}
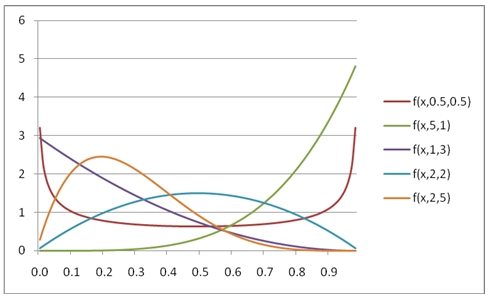
You can use the SeriesFloat function from the XLeratorDB/math library to generate a dataset which can be pasted into EXCEL to generate a graph of the function.
SELECT SeriesValue,
       wct.BETAPDF(SeriesValue, 0.5, 0.5, NULL, NULL) as [f(x,0.5,0.5)],
       wct.BETAPDF(SeriesValue, 5, 1, NULL, NULL) as [f(x,5,1)],
       wct.BETAPDF(SeriesValue, 1, 3, NULL, NULL) as [f(x,1,3)],
       wct.BETAPDF(SeriesValue, 2, 2, NULL, NULL) as [f(x,2,2)],
       wct.BETAPDF(SeriesValue, 2, 5, NULL, NULL) as [f(x,2,5)]
FROM wct.SeriesFloat(.01, .99, .01, NULL, NULL);
This is an EXCEL-generated graph of the results: